Model
Crustal & Lithospheric Density Model 1 (CLDM1)
A global 1°×1° density model of the Earth's crust and lithosphere derived from joint seismic and satellite gravity inversion.
Model Overview
This model presents the global lateral density variations of the Earth's lithosphere, represented by the density structure of a spherical equivalent source layer. It is derived from a joint inversion of satellite gravity data and the seismically constrained ECM1 model, which provides the long-wavelength structure (spherical harmonic degrees 0–13) while higher-degree gravity data resolve finer density features. The recovered density model has a spatial resolution of approximately 1° and clearly resolves systematic density contrasts across different crustal types and tectonic settings, from stable cratonic lithosphere to active margins and oceanic plateaus. It offers new insights into the thermal and compositional controls on lithospheric density and complements the global lithospheric magnetization model for integrated studies of the solid Earth.
Model Visualization
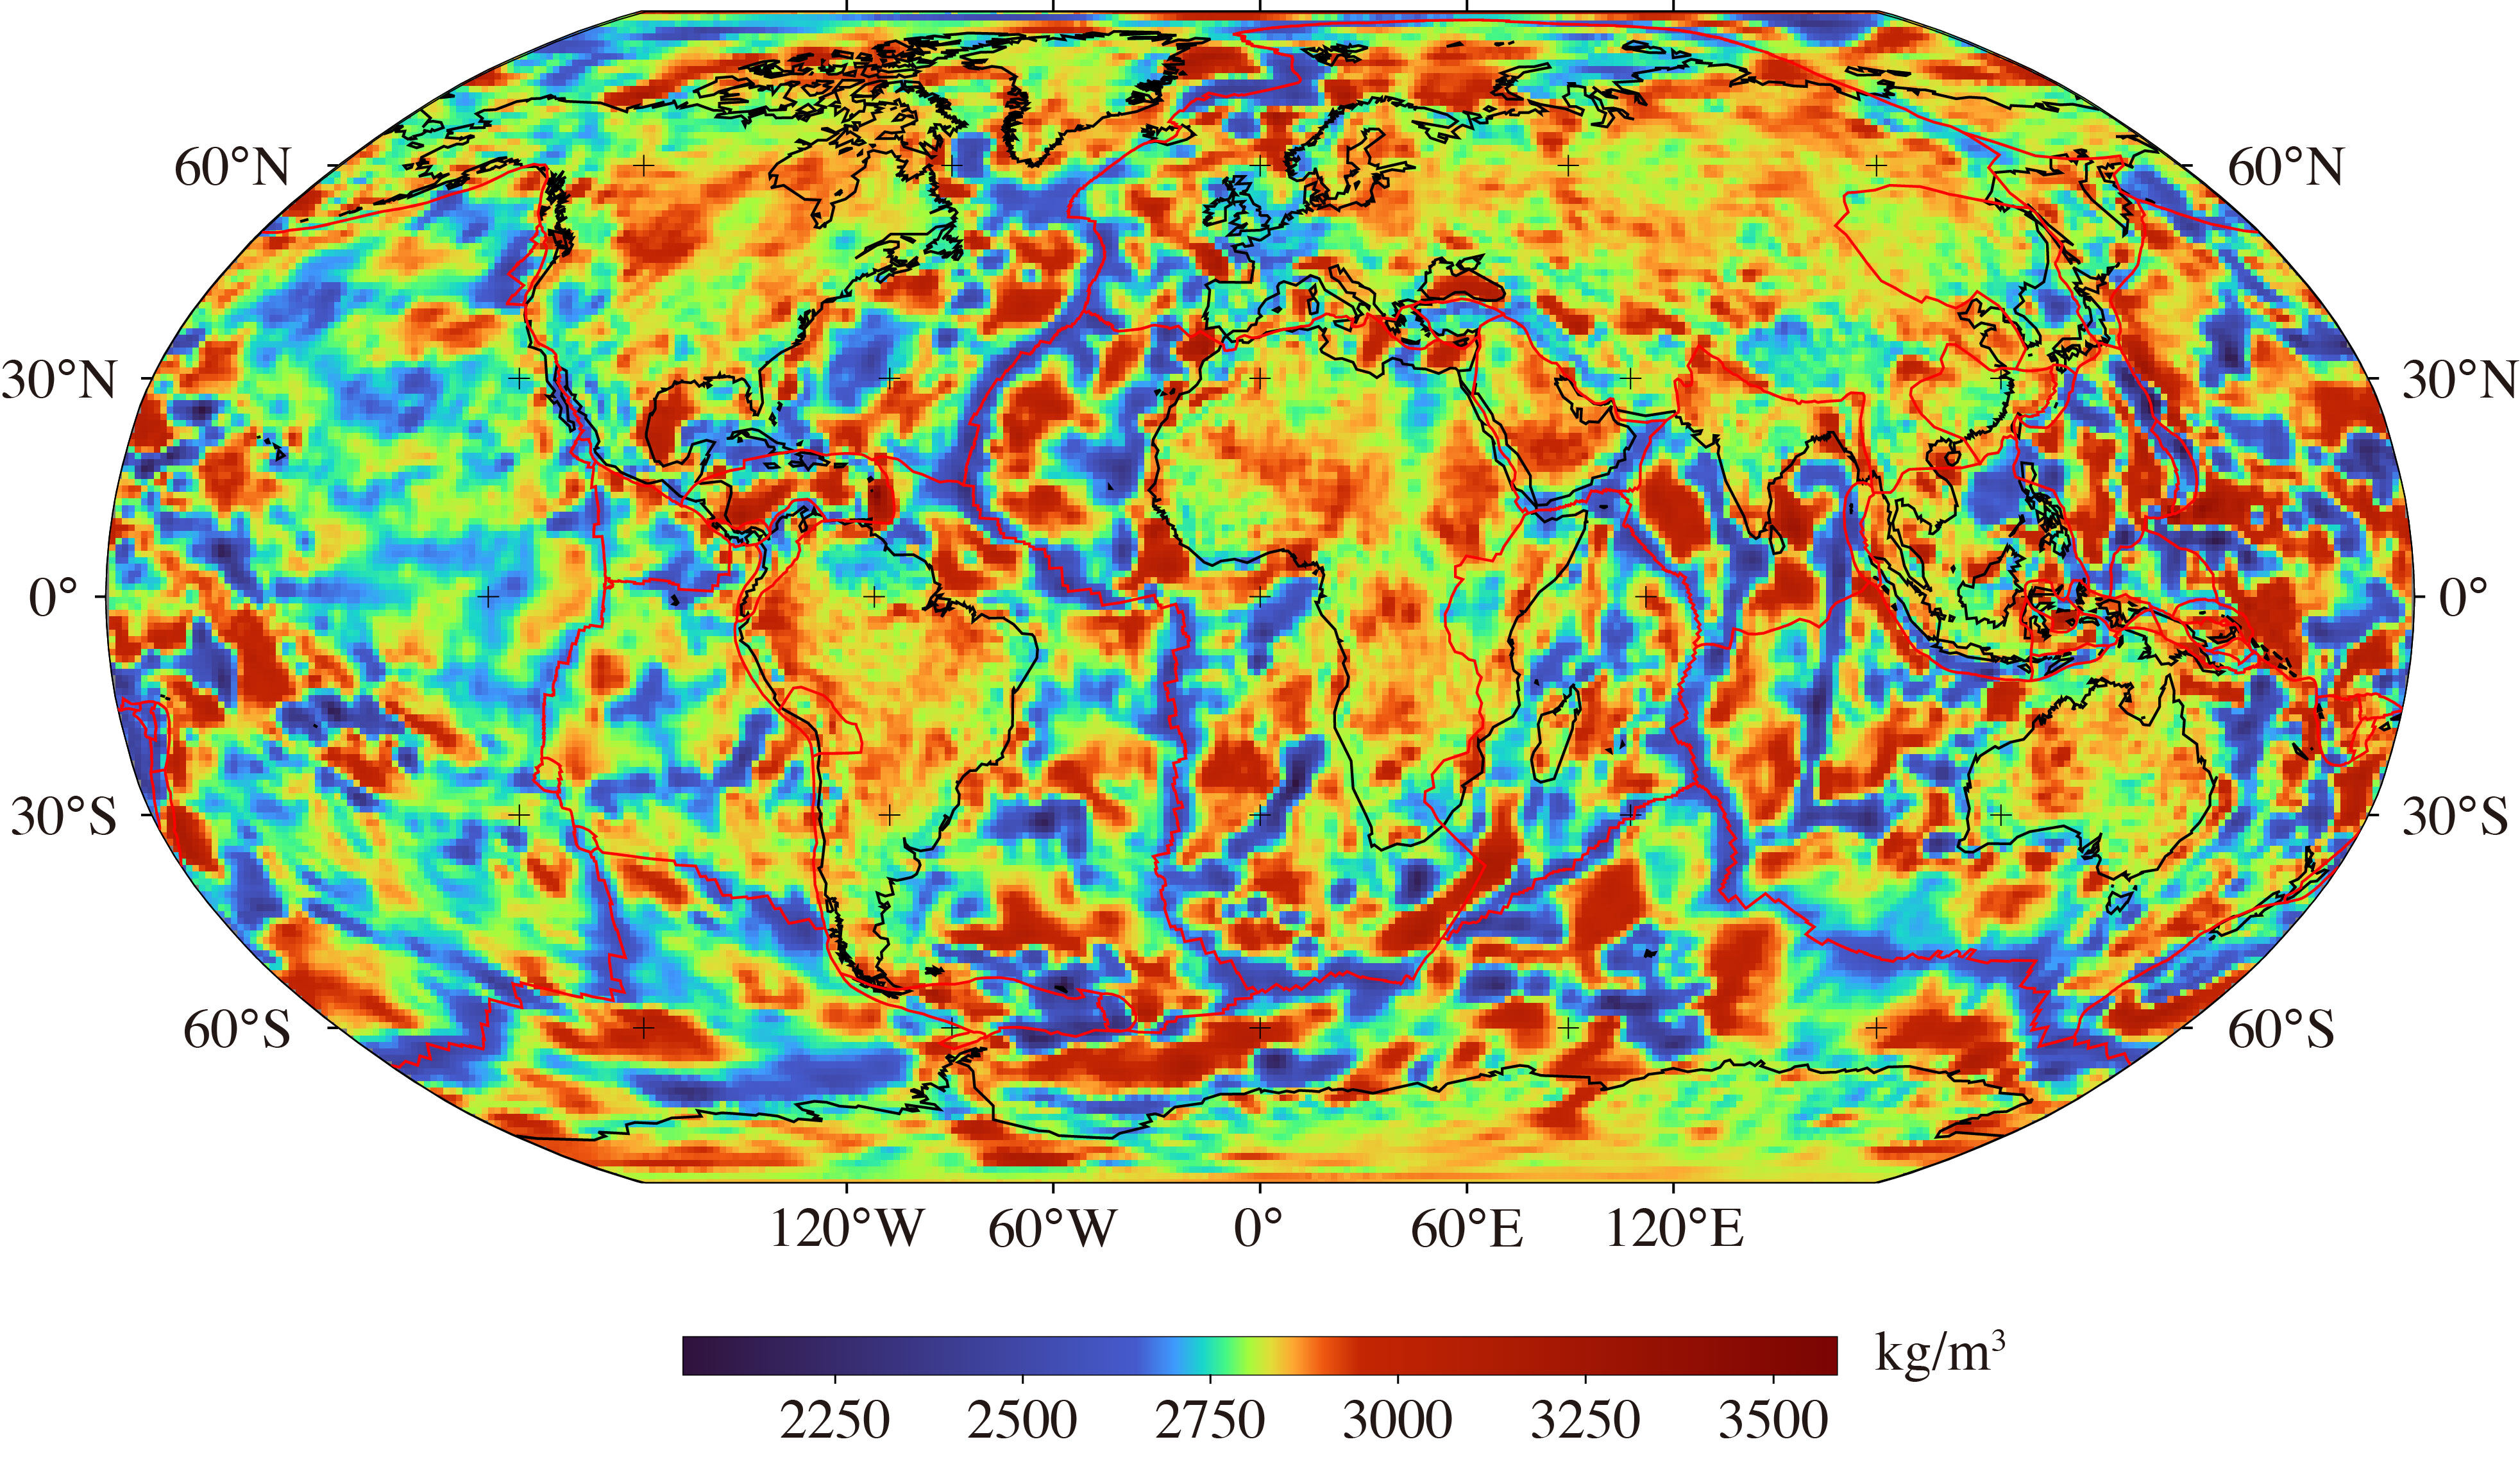
Inverted equivalent density model of the crust. Continental and plate boundaries are drawn in black and red lines, respectively.
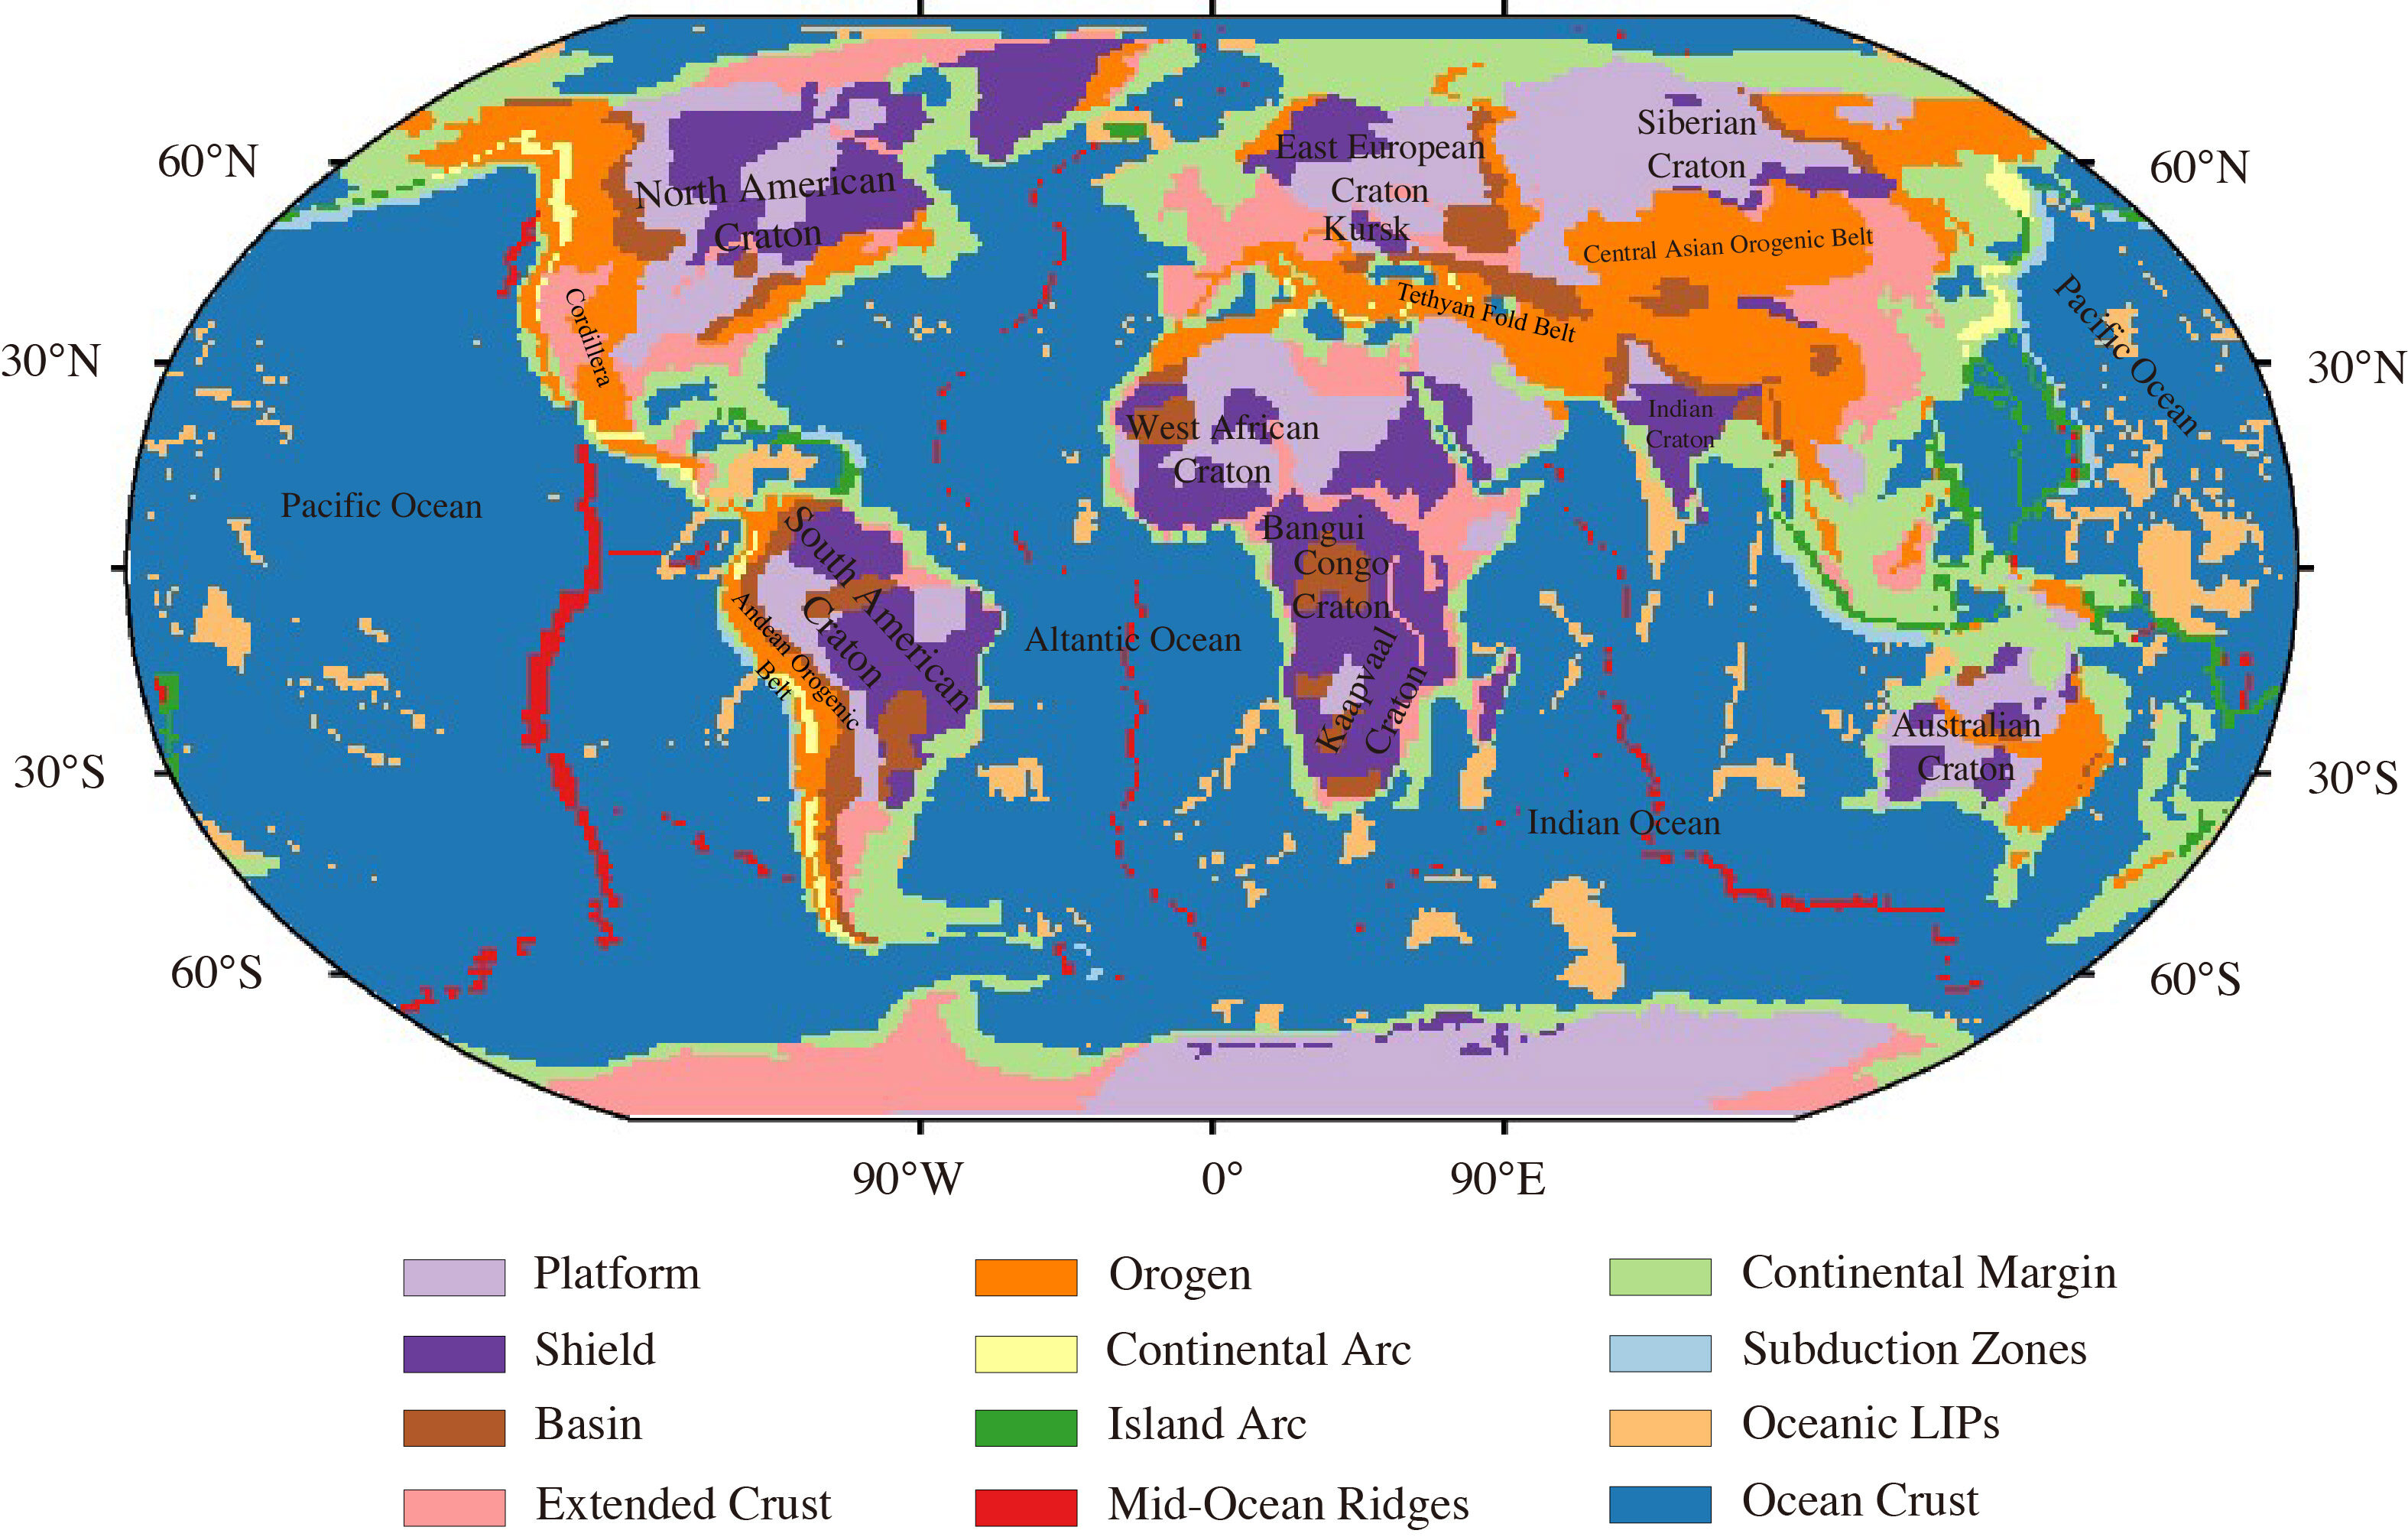
Global crustal-type map (Mooney et al., 2023), which shows twelve crustal units. Major tectonic regions are also marked in the figure. A MapGIS version of this map could be found at ECM1.
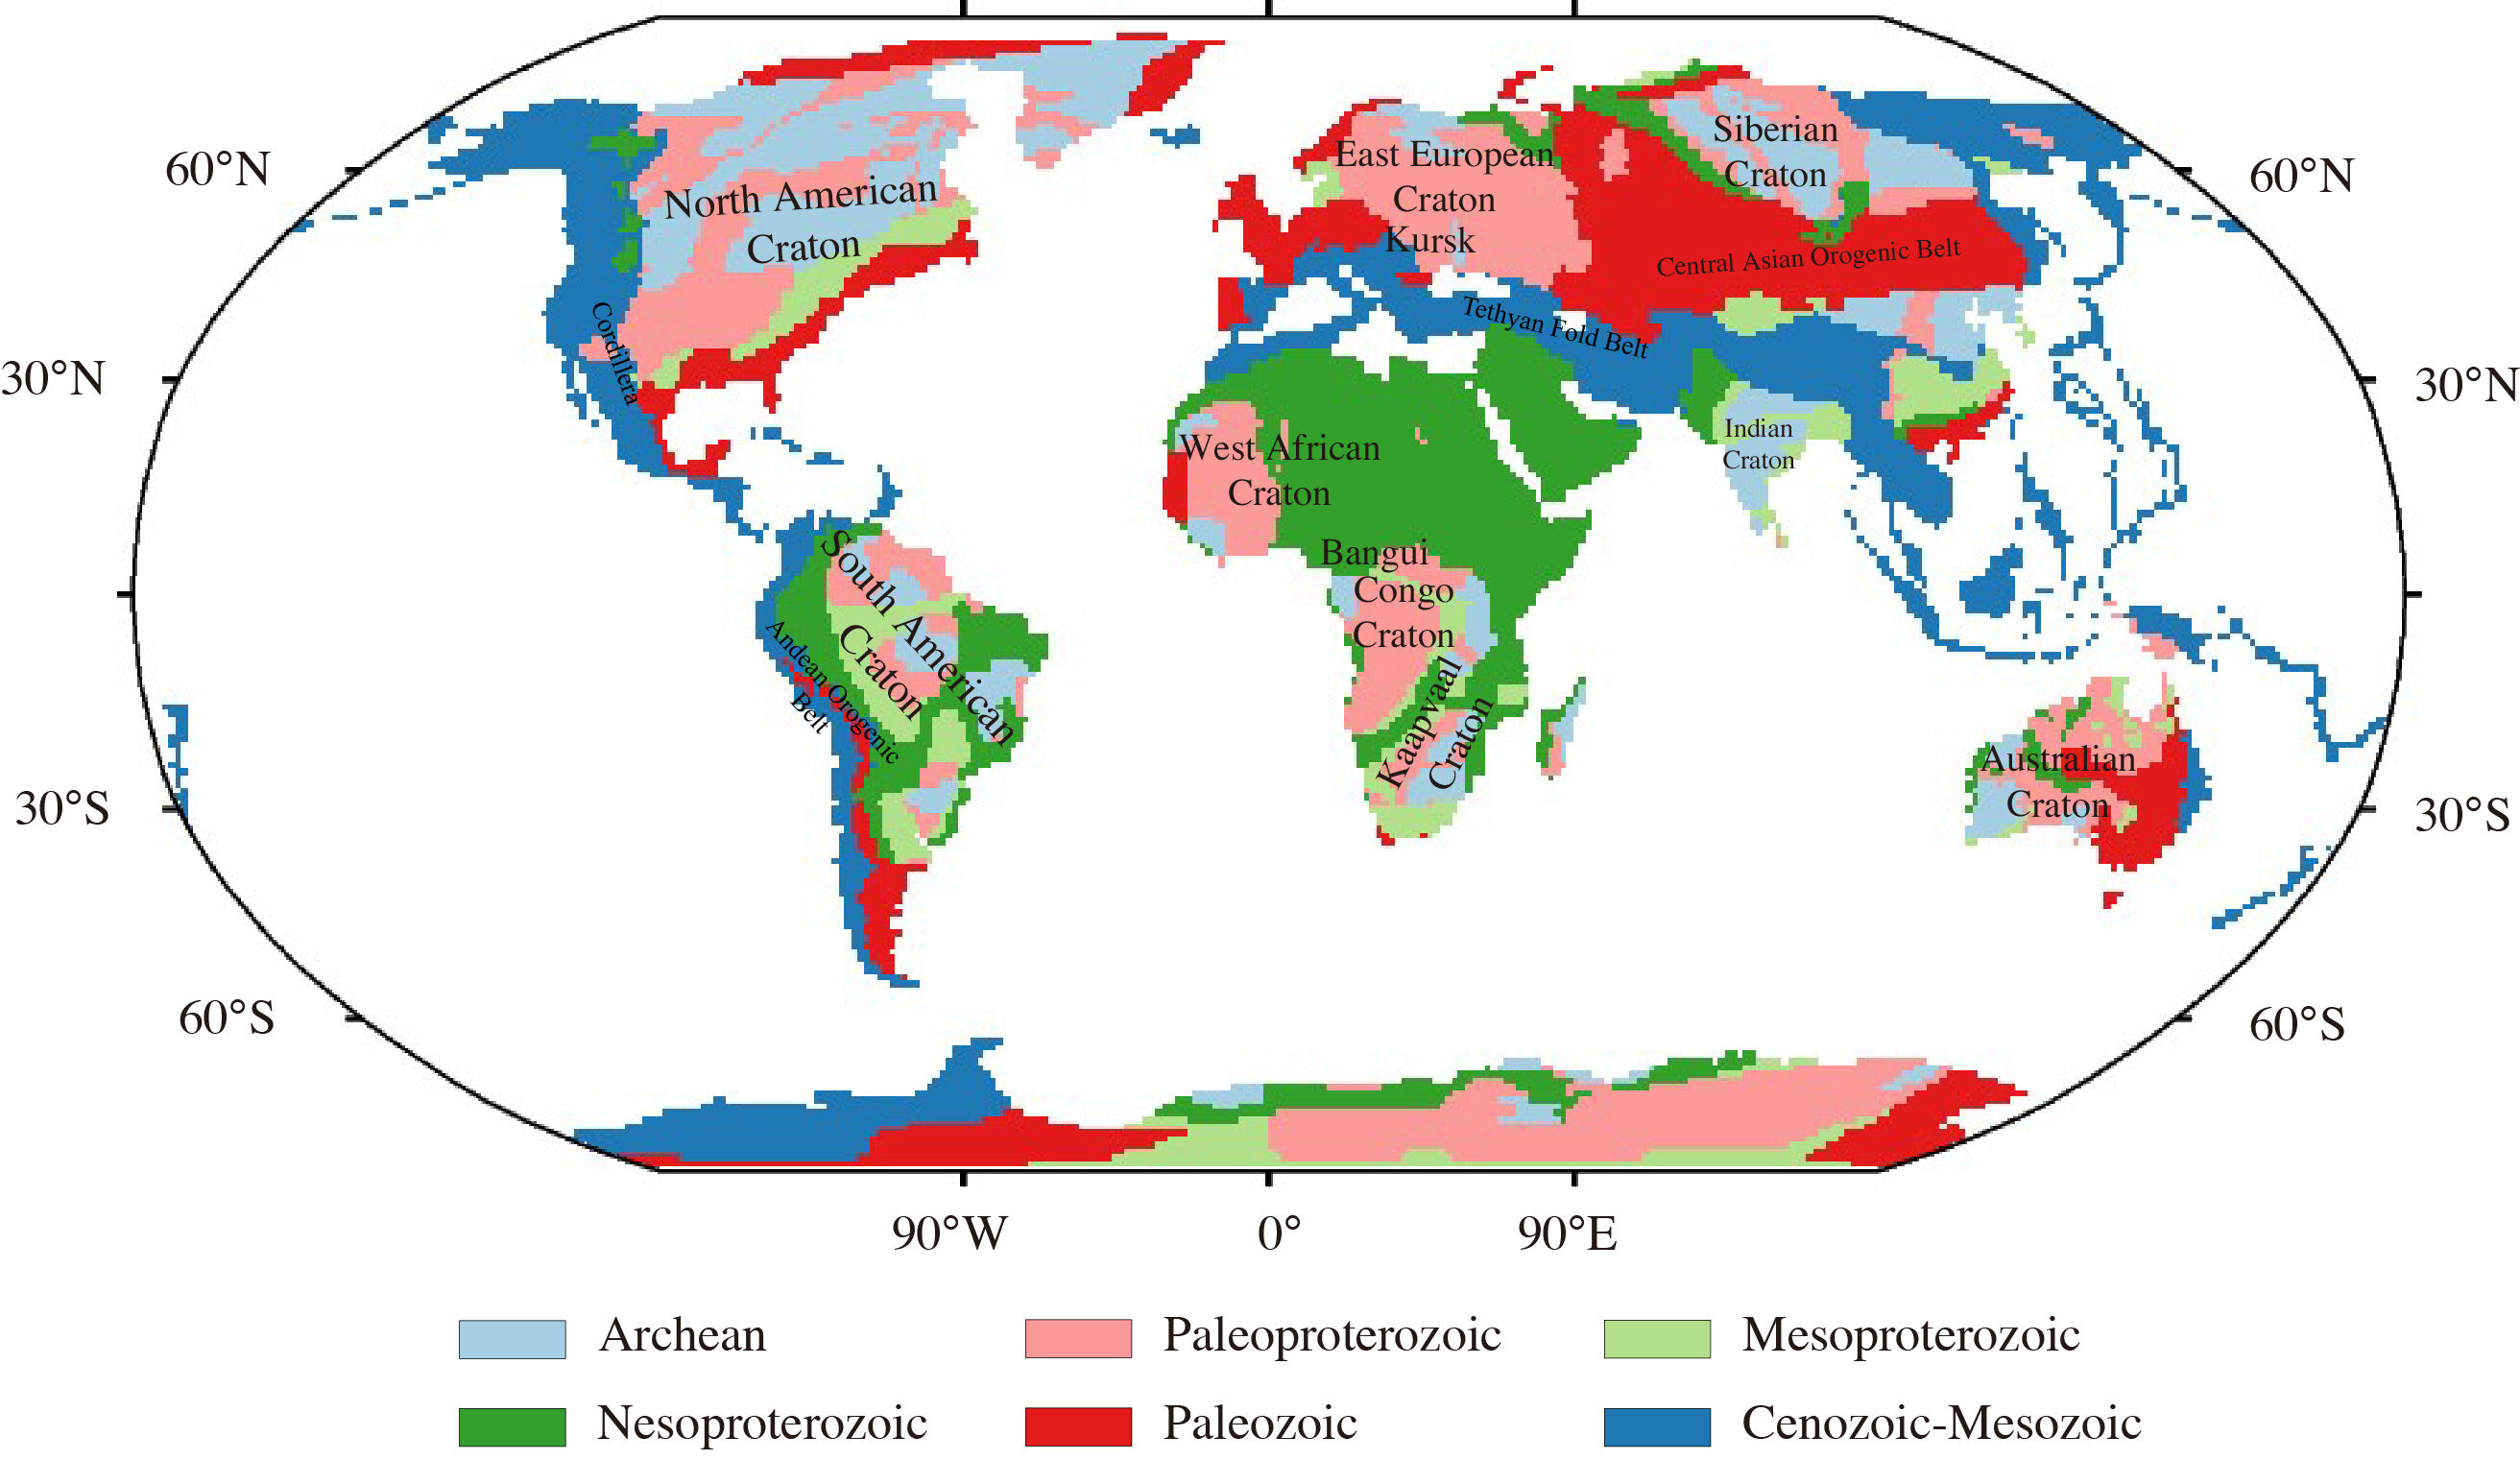
Global basement age map (Gubanov & Mooney, 2009, 2014), which shows six age units: Achaean (3.8–2.5 Ga), Paleoproterozoic (2.5–1.6 Ga), Mesoproterozoic (1.6–1.0 Ga), Neoproterozoic (1.0–0.54 Ga), Paleozoic (543–250 Ma), and Mesozoic-Cenozoic (250–0 Ma). Major tectonic regions are also marked in the figure. A MapGIS version of this map could be found at ECM1.
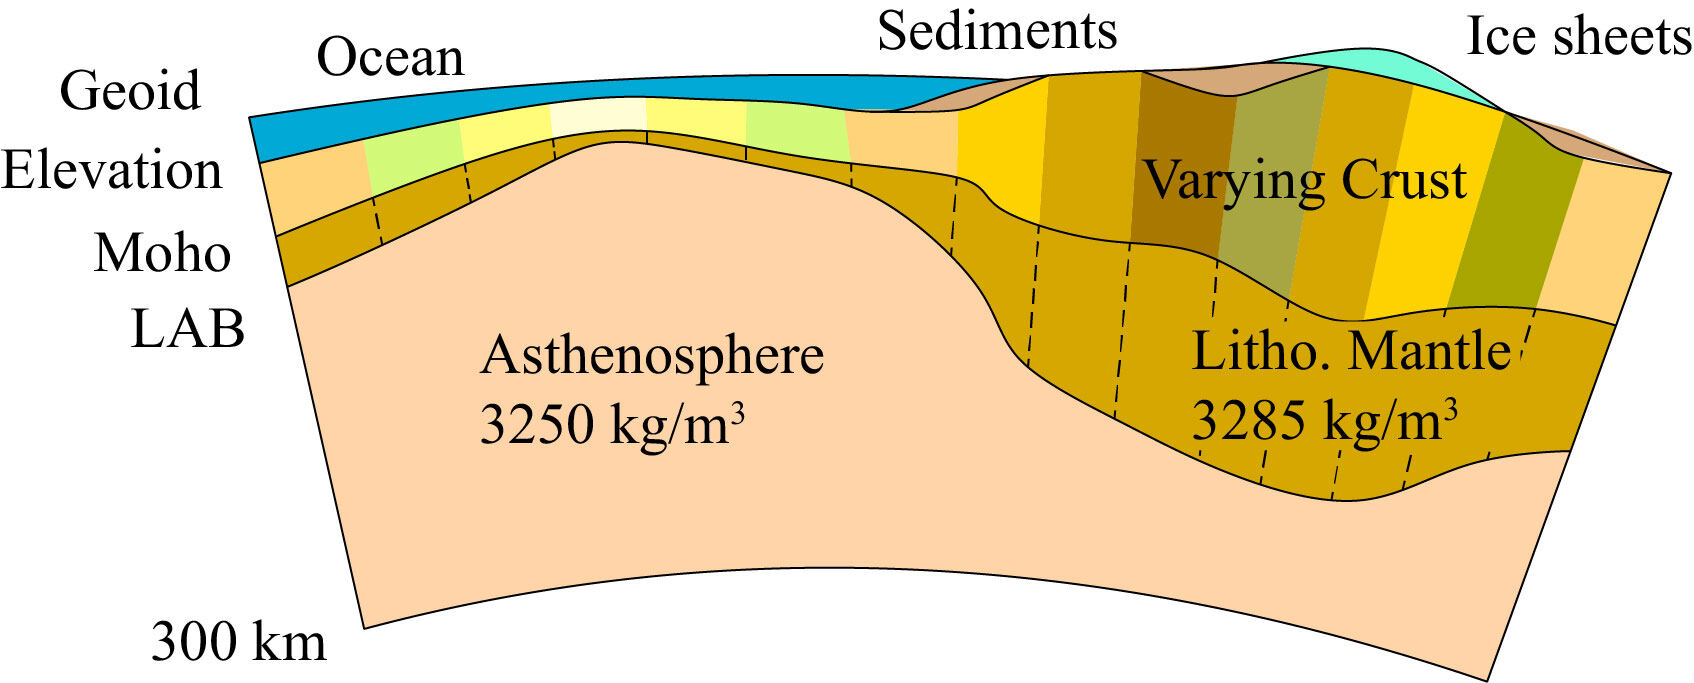
Schematic illustration of the model setup. The observed satellite gravitational disturbances are assumed to be generated by a multi-layer density model comprising an ice layer, a water layer, three sedimentary layers, a crustal layer, a lithospheric mantle layer, and an asthenosphere layer. The depth interfaces and density properties of the ice, water, sedimentary layers, and Moho depth are taken from the ECM1 (Mooney et al., 2023). The lithospheric mantle and asthenosphere are assigned uniform densities (Lamb et al., 2020), and the LAB depth is taken from the mean lithospheric thickness model of Steinberger & Becker (2018). A crustal layer with laterally varying densities is placed between these layers. Note that the lithospheric mantle layer is marked with vertical dashed lines, indicating that its lateral density variations could be estimated once the crustal density variations are determined.
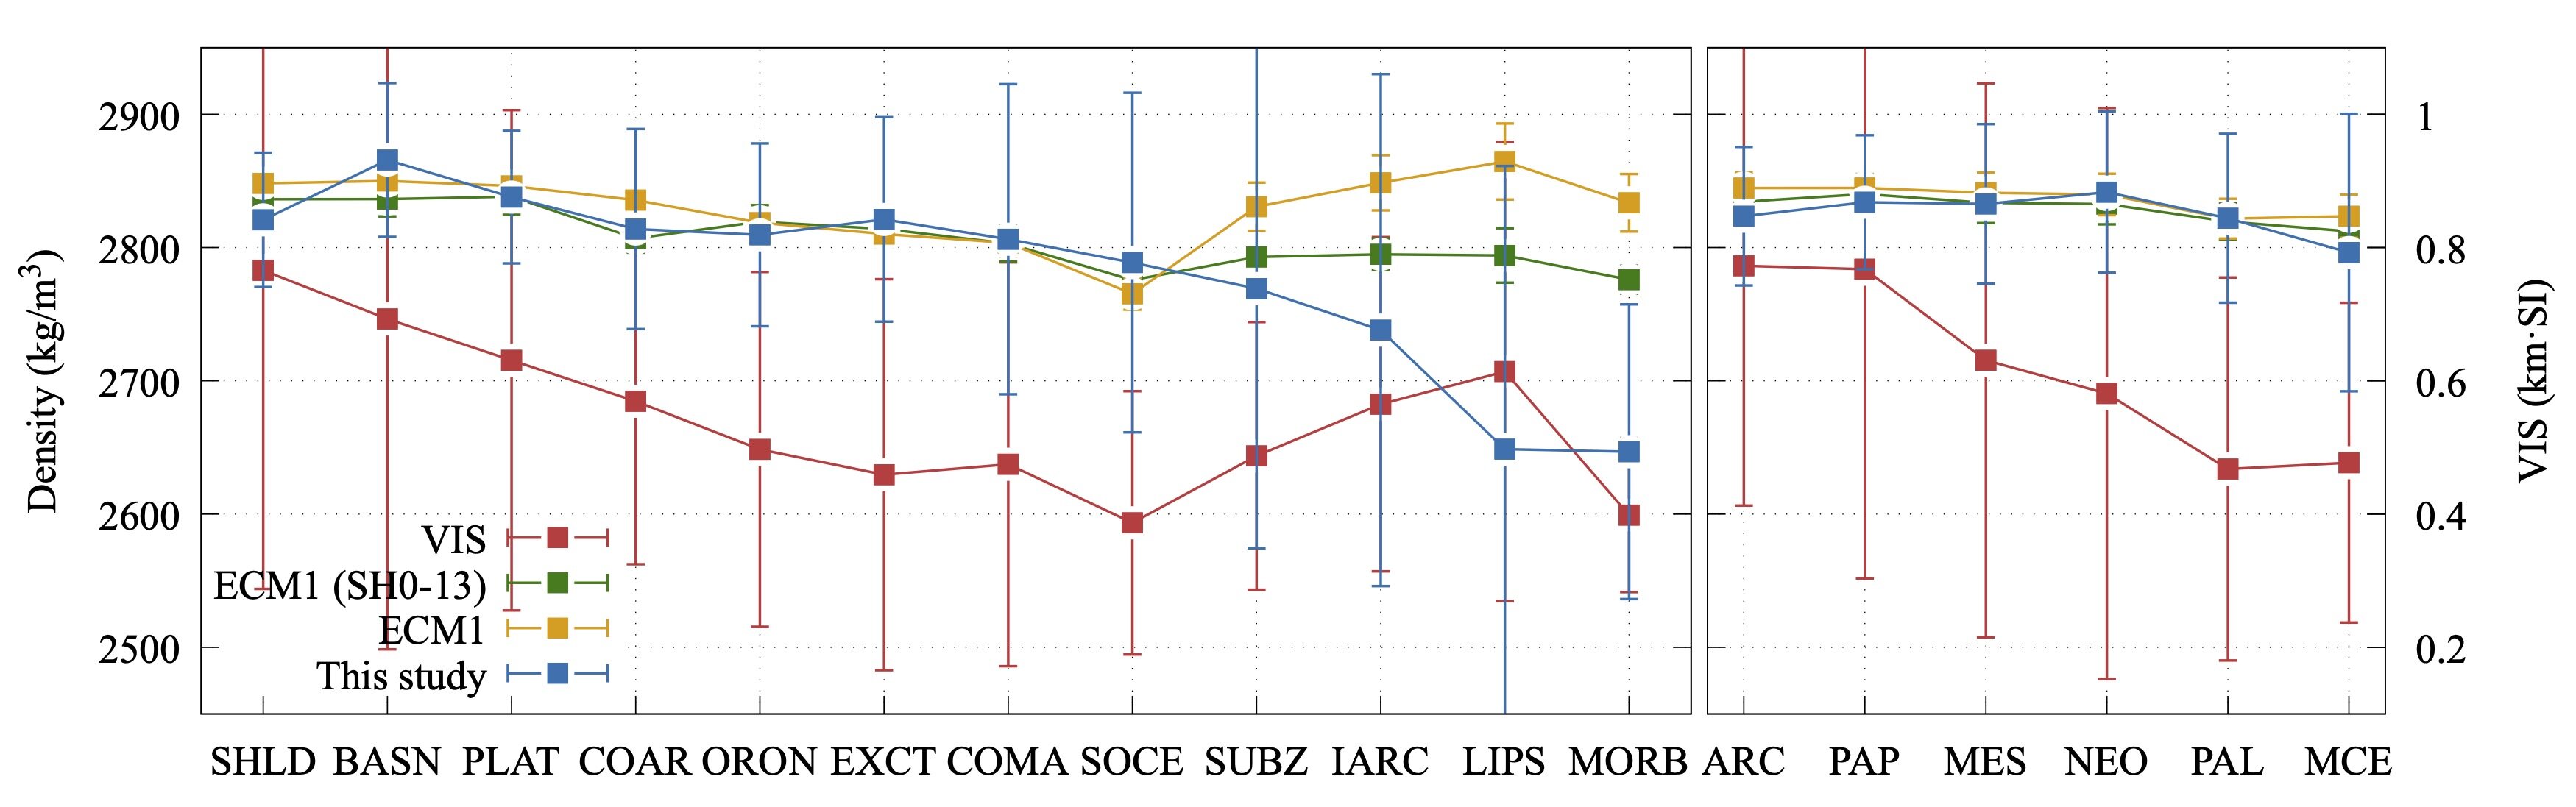
Comparison of mean density values between the inverted model and the ECM1 (including its long-wavelength component between SH degrees 0-13) across different crustal types (left panel) and basement ages (right panel). Corresponding statistics are presented in the corresponding paper. Vertical short lines indicate ±1 standard deviations. Spatial regions of the groups are shown in Figure 2 and Figure 3. Statistics of the lithospheric induced magnetization, represented as the Vertical Integrated Susceptibility (VIS; Zhang et al., 2026), are also shown to assist interpretations. SHLD–Shield; PLAT–Platform; BASN-foreland and cratonic Basin; ORON–Orogen; EXCT–Extended Crust; COMA–Continental Margin; COAR–Continental Arc; IARC–Island Arc; LIPS–Oceanic Large Igneous Provinces (LIPs); SOCE–Ocean Crust; MORB–Mid-Ocean Ridges; SUBZ–Subduction Zones; ARC–Archean; PAP–Paleoproterozoic; MES–Mesoproterozoic; NEO–Neoproterozoic. PAL–Paleozoic; MCE–Mesozoic-Cenozoic.
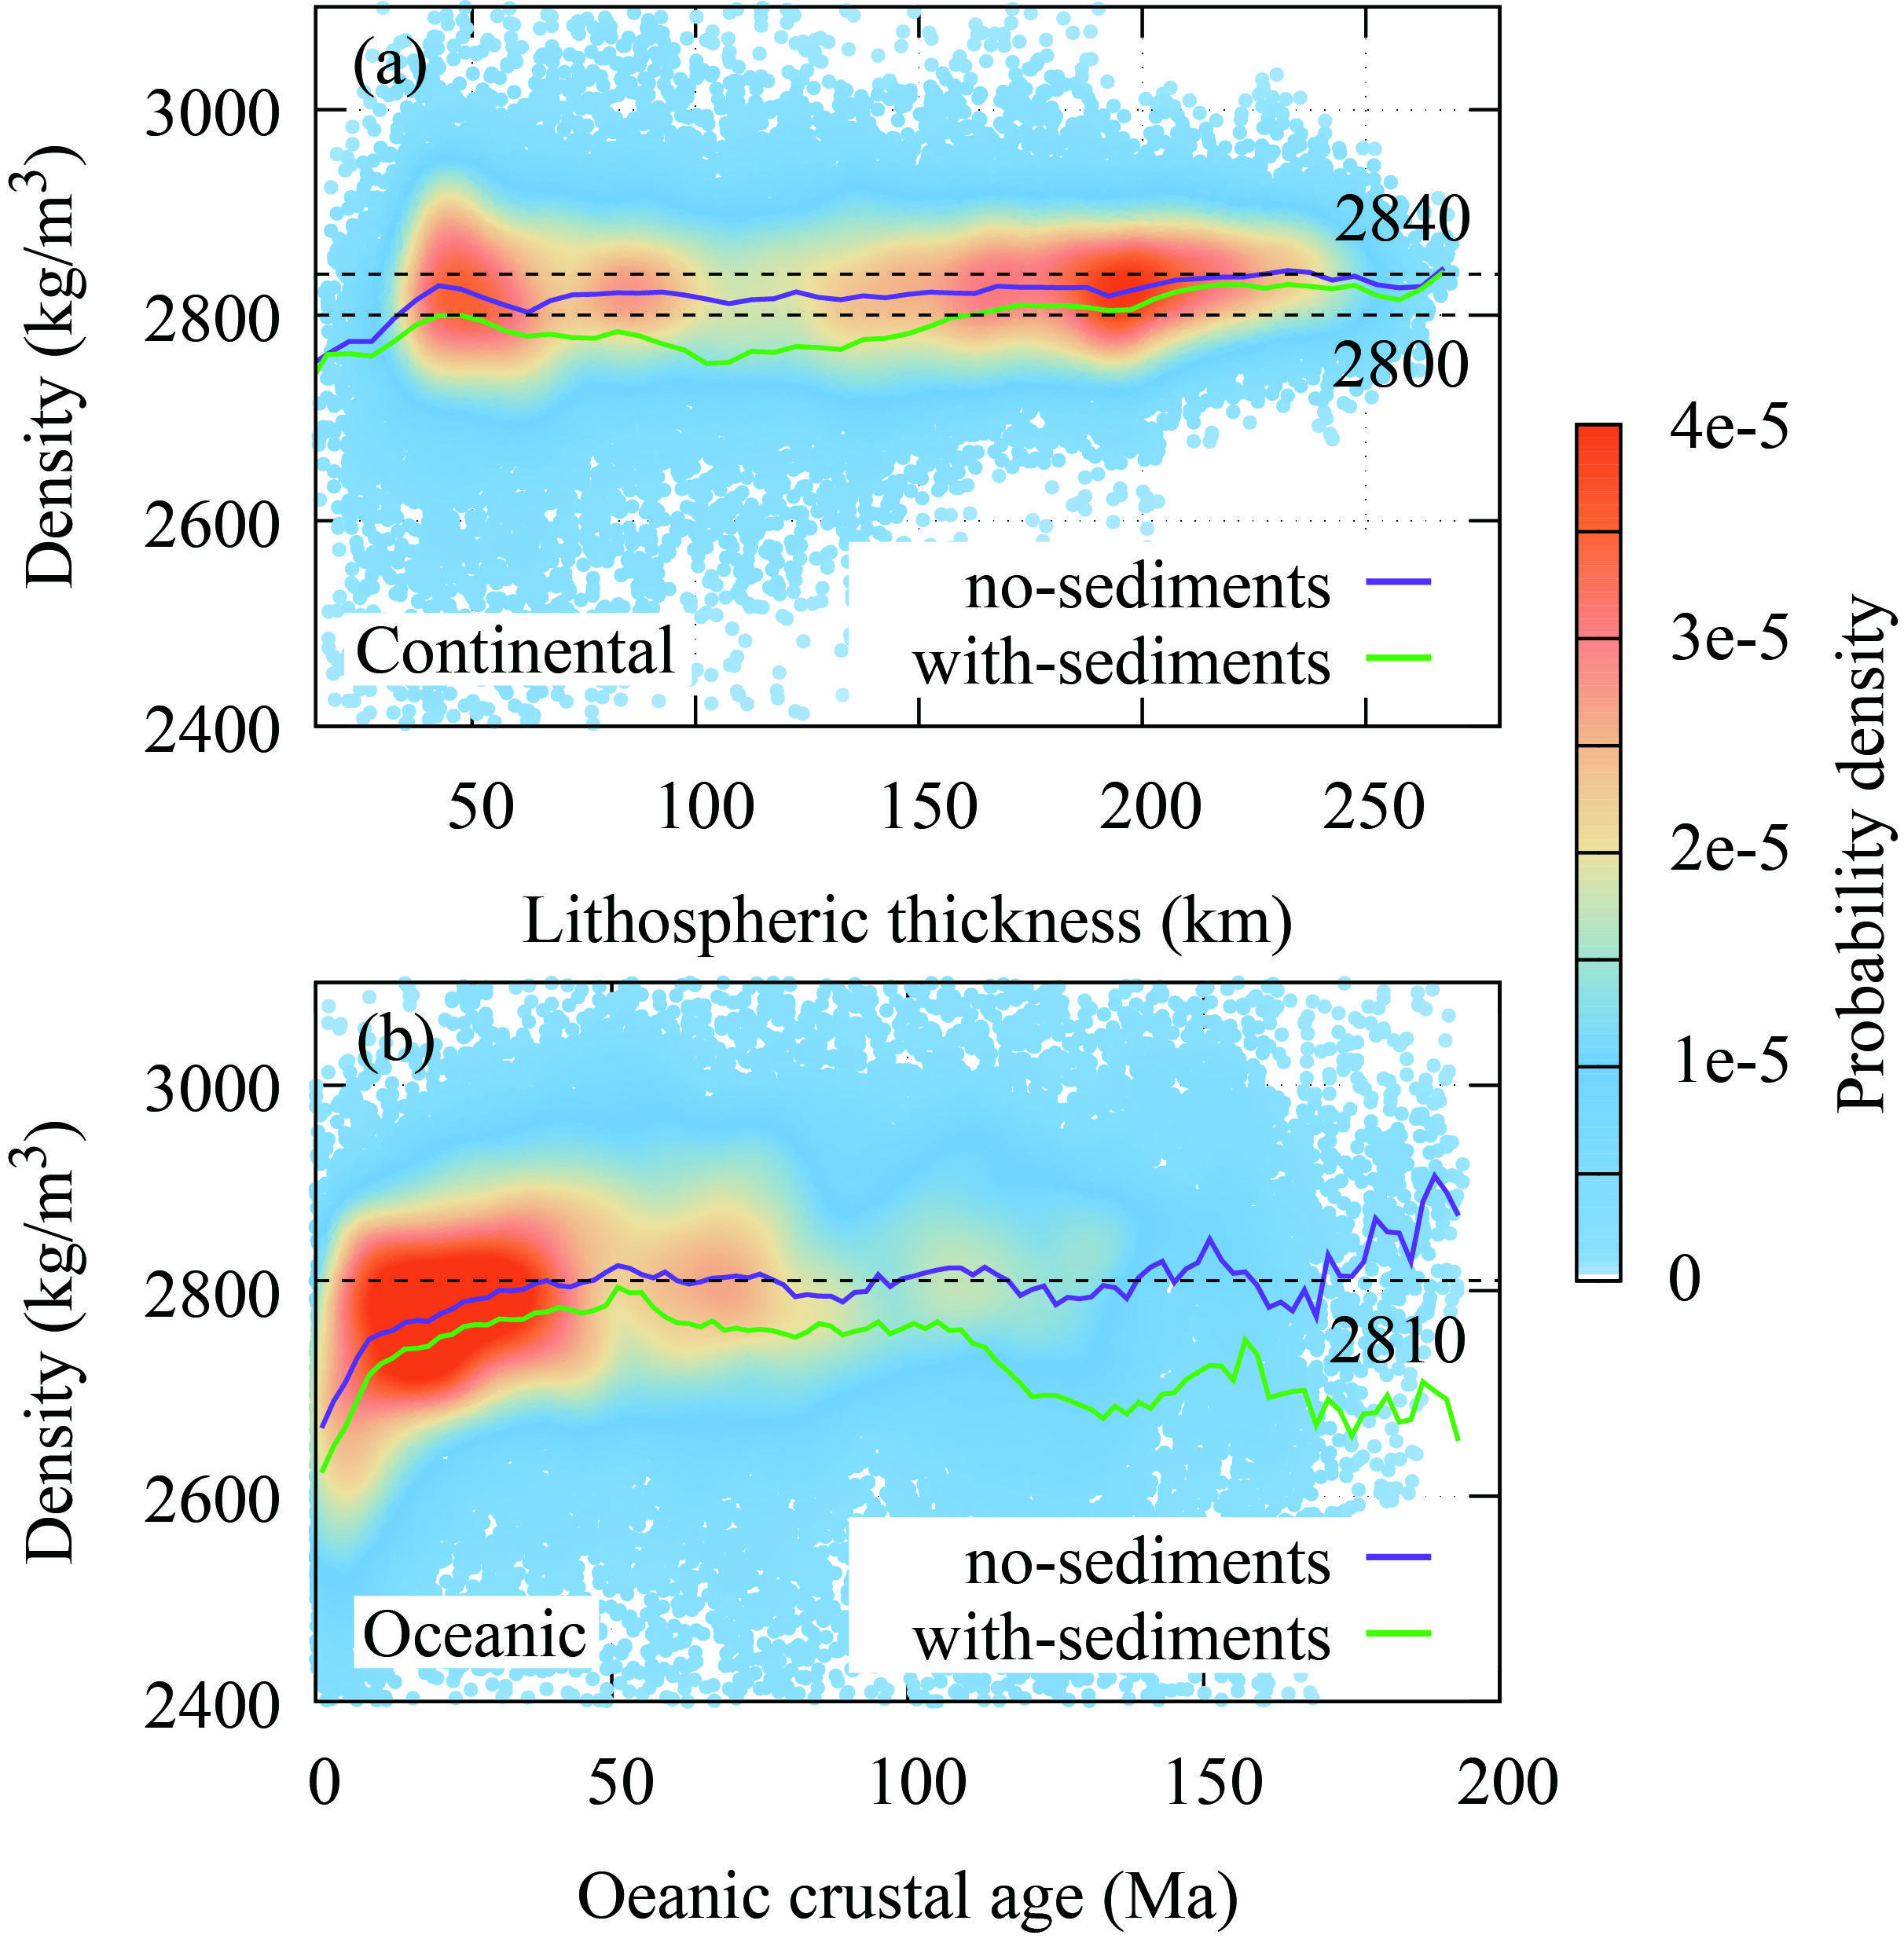
Inverted density values within the (a) continental region and (b) oceanic region plotted against the lithospheric thickness (Steinberger & Becker, 2018) and seafloor age (Seton et al., 2020), respectively. Colors indicate the Kernel Density Estimation (KDE) of each point. The mean density is calculated as a KDE-weighted average to reduce the contribution of outliers, with data intervals of 5 km (continental) and 4 Ma (oceanic). Densities from an alternative equivalent density model marked as “with-sediments” are also shown in the figure. This model is obtained without sediment gravity corrections, and its upper and lower boundaries are defined by the top of the sedimentary layers and the Moho, respectively.
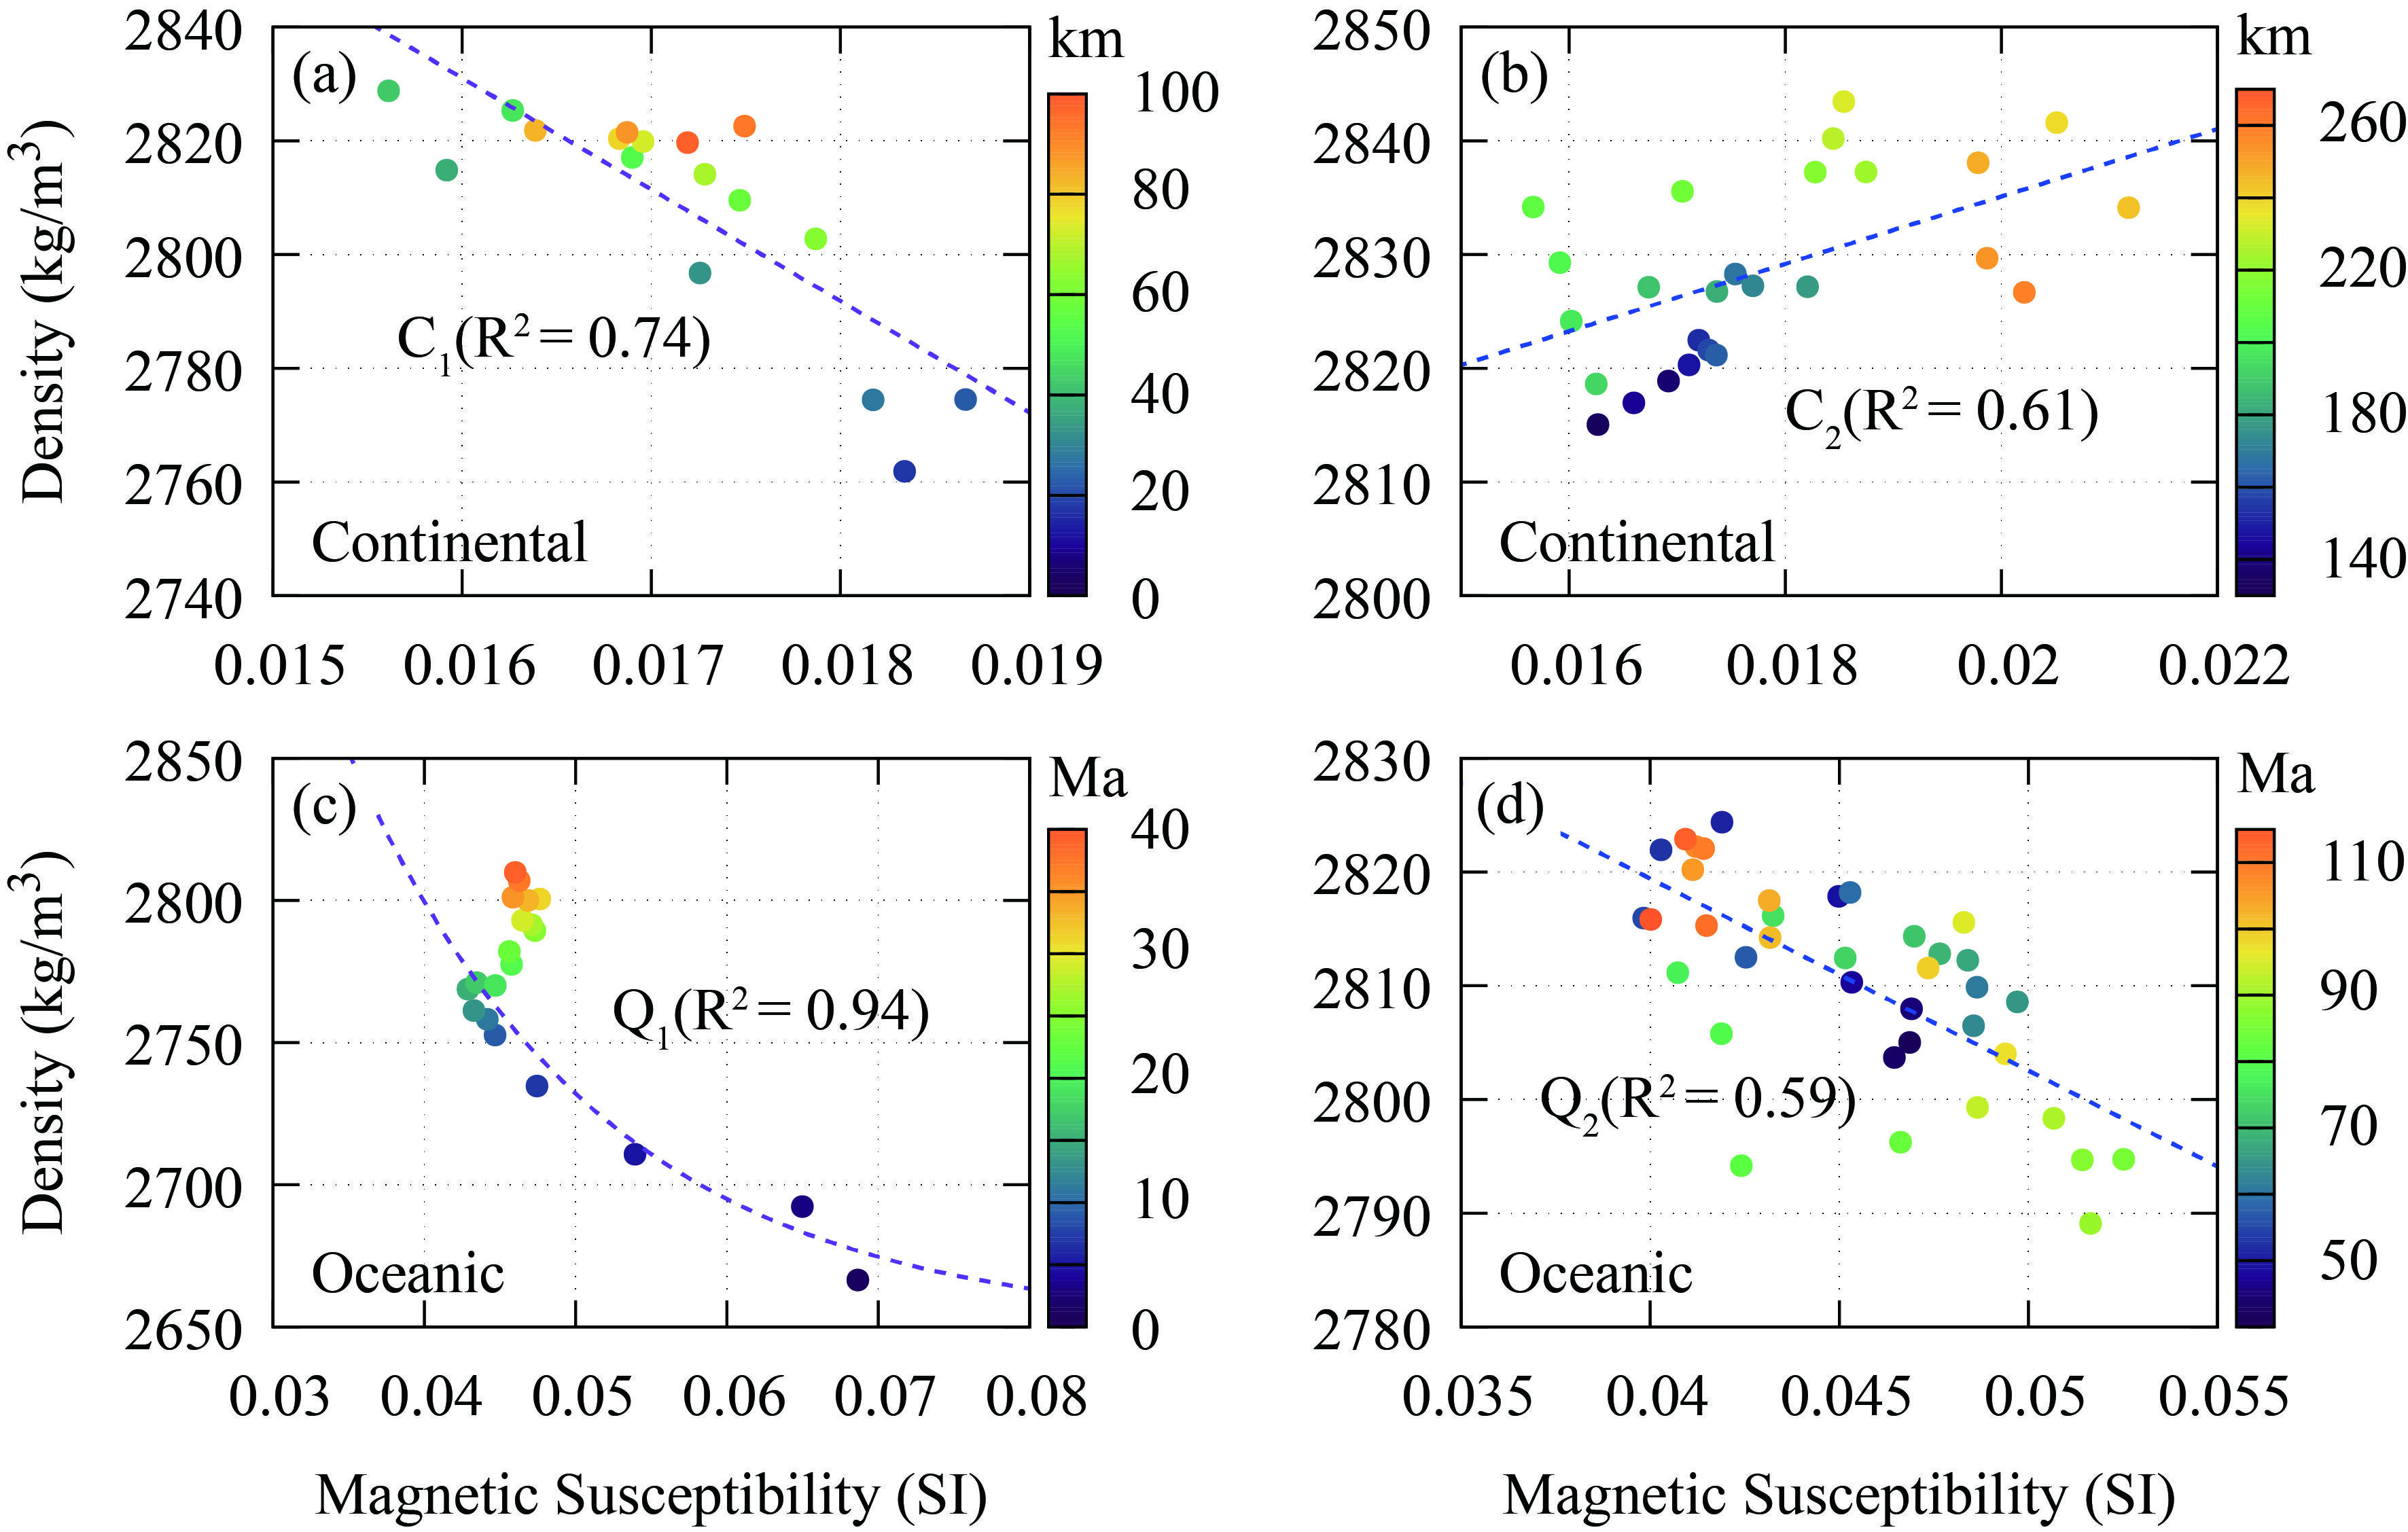
Scatter plots of binned mean magnetic susceptilibity versus density values (Figure 5). Panels (a) continental lithospheric thickness <100 km (vertical color bar); (b) continental lithospheric thickness >130 km; (c) oceanic seafloor ages <40 Ma; (d) oceanic seafloor ages >40 Ma. The corresponding linear fits are: (a) C1 (15-100 km): ρ= 3144.8-19608.9σ, (b) C2 (>130 km): ρ=2775.8+2964.65σ, (c) Q1 (<=40 Ma): ρ=2649.9+497.1e^{-60(x-0.02)}, (d) Q2 (40-115 Ma): ρ=2886.93-1687.7σ. The susceptilibity is defined as the induced lithospheric magnetizaiton (Zhang et al., 2026) divided by the Currie point depth (Gard & Hasterok, 2021) and calculated as a KDE-weighted average with data intervals of 5 km (continental) and 4 Ma (oceanic), respectively.
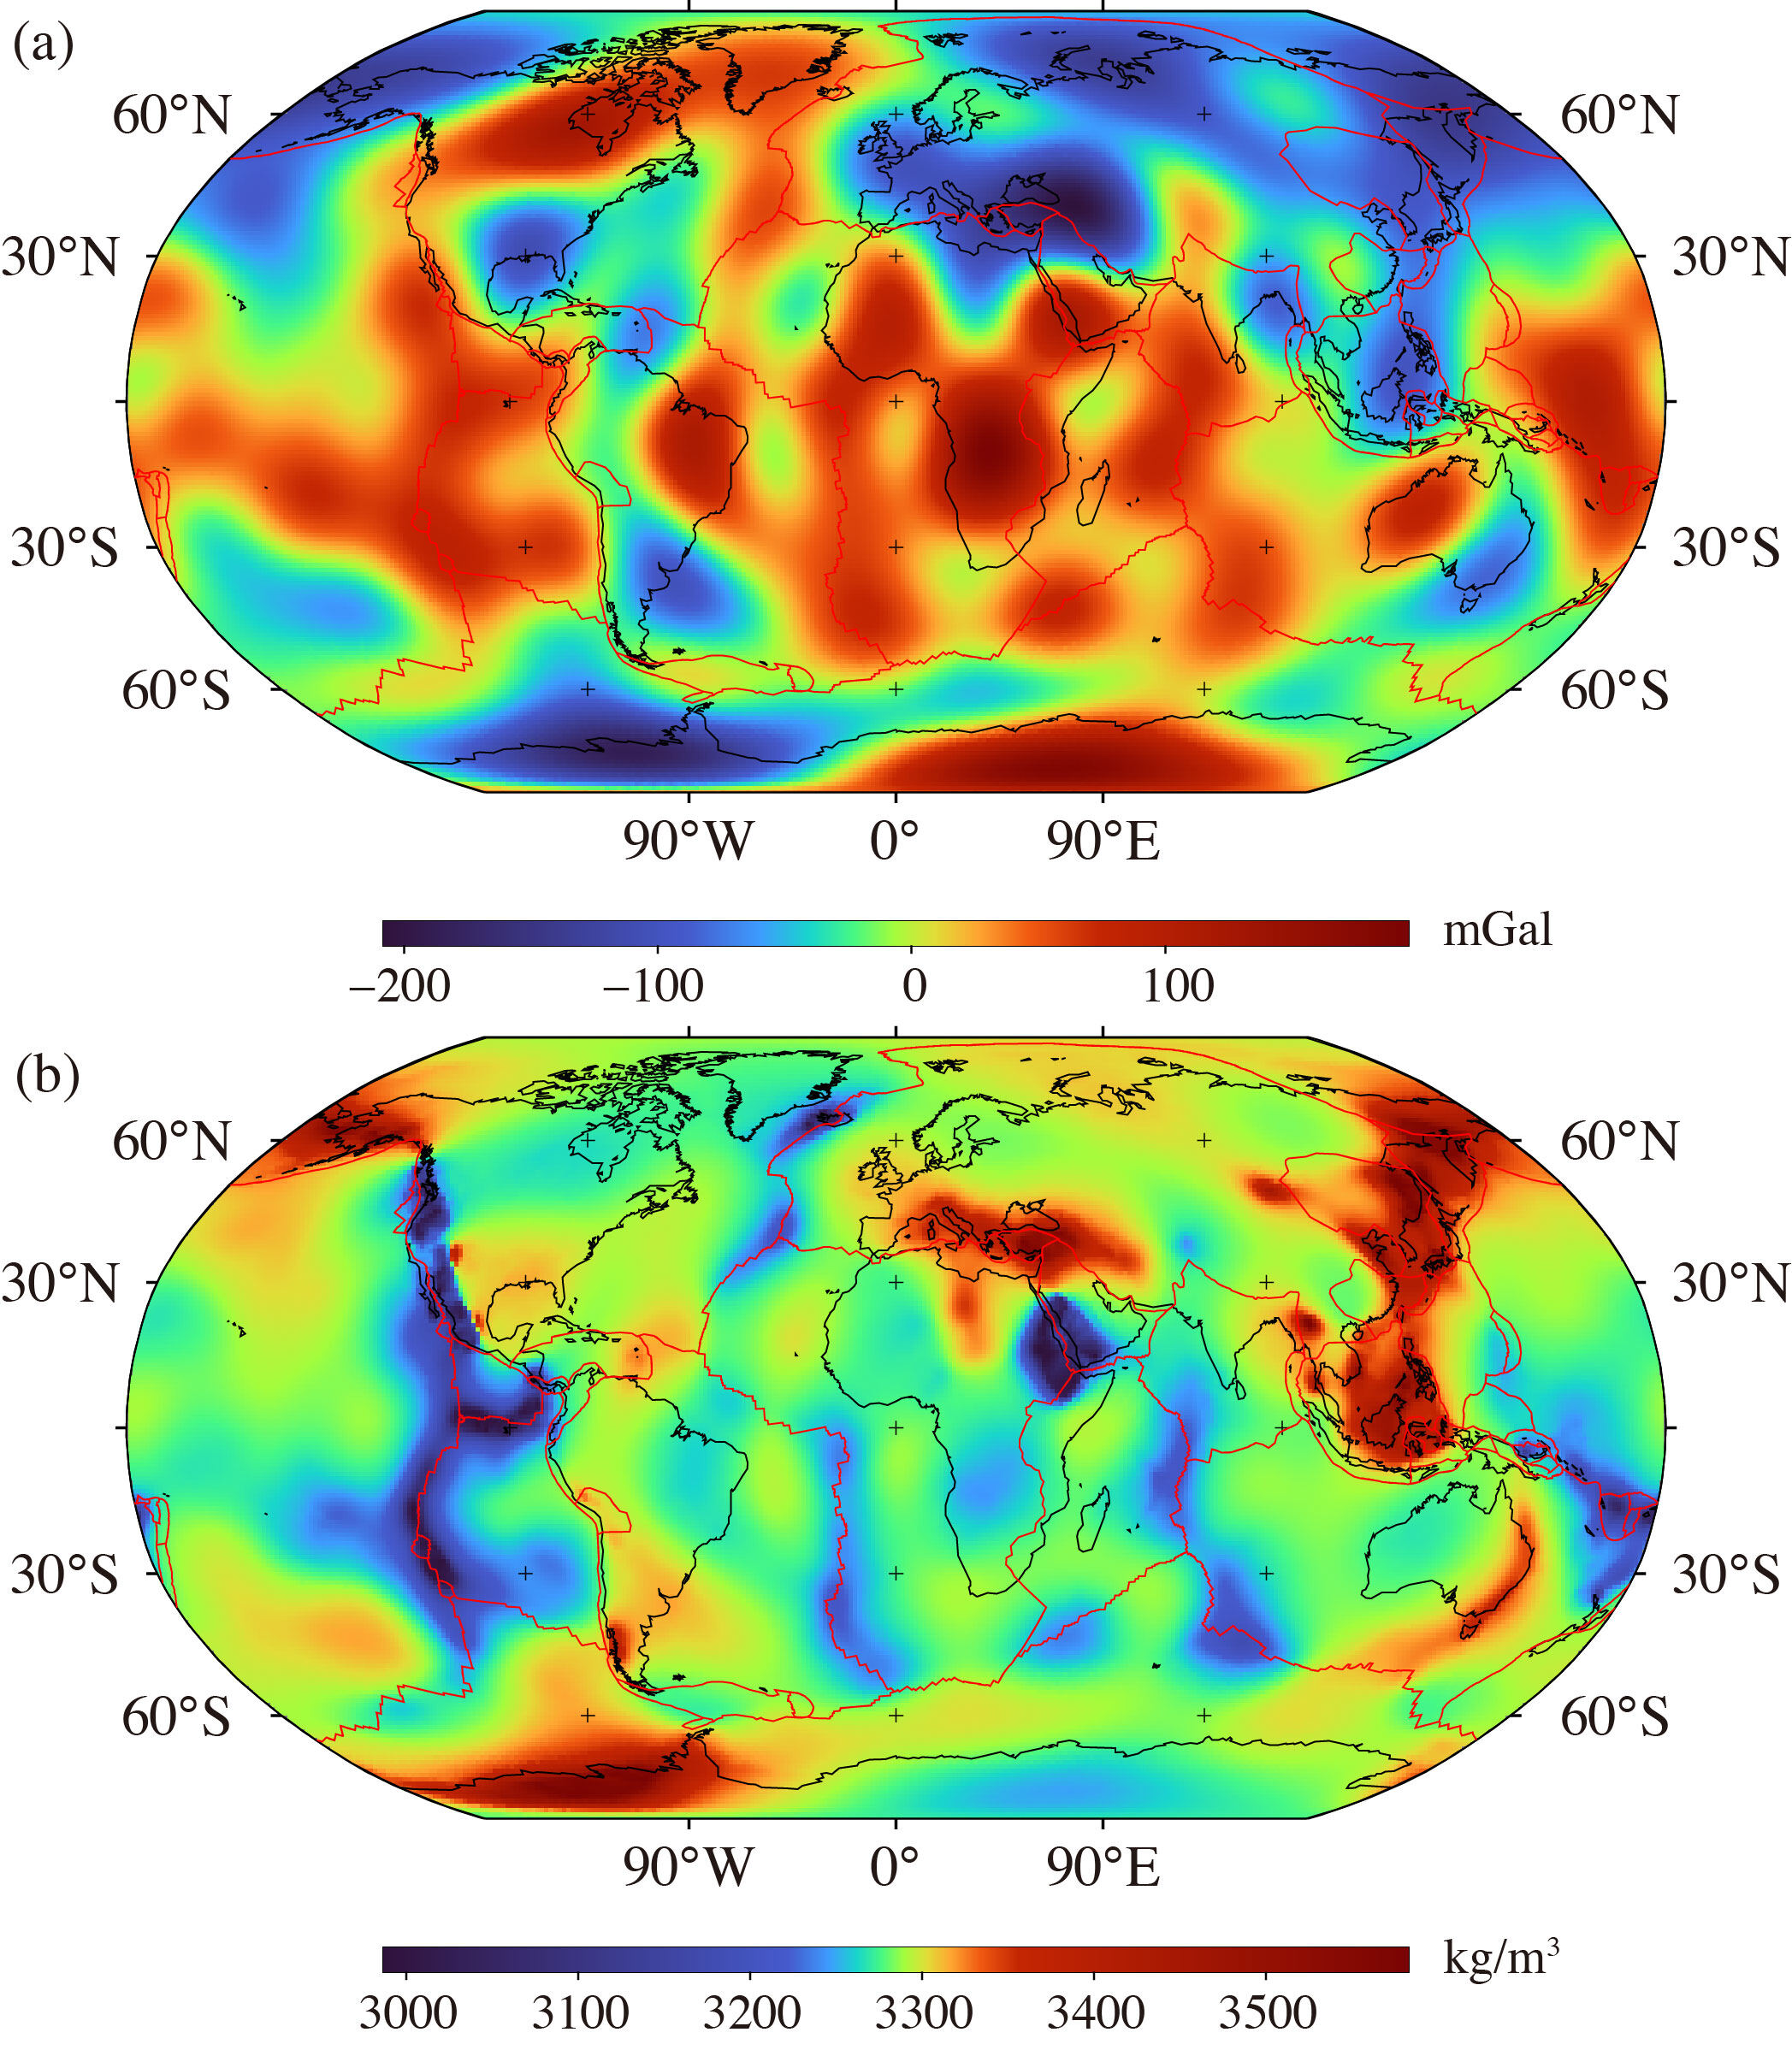
(a) Reproduced long-wavelength gravitational disturbances from the inverted density model (SH degrees 1-12), and (b) the corresponding density structures of the lithospheric mantle assuming the lithospheric gravity field is entirely cancelled at long wavelengths. See text for discussion.
Data Downloads
All files are released for academic research and teaching. Please read the README before use and cite the model in your publications.
CLDM1.csv
Global crustal density model on a spherical triangular grid, directly output by the inversion program.
CLDM1_grav_shc.csv
Spherical harmonic coefficients of the crustal gravity anomaly model corresponding to the density model, allowing users to forward-compute gravity anomaly data at any desired spherical harmonic degree.
CLDM1_grid.nc
Gridded version of the spherical harmonic coefficient model at 1° × 1° resolution.
CLDM1_litho_grid.nc
Gridded lithospheric mantle density model at 1° × 1° resolution. The physical meaning and limitations of the model are described in the associated paper.
Zhang, Y., Mooney, W. D., Sun, S., & Xu, Y. (2026). Lithospheric density variations derived from seismic and satellite gravity constraints. In preparation.